
 Token Regain a $0.5 Range In 2023?")
- The FTM token may reach $0.5 in 2023.
- It is currently trading at $0.202 with a rise of 1.39% in the last 24 hours.
- The token is down from its all-time high value by 94.17%.
Fantom offers a sophisticated platform for developing dApps. FTM is an ERC-20 token and serves as the native crypto asset for the Fantom platform. Its Architecture allows the developers to build highly scalable, efficient, fast, and inexpensive applications on the Web3.0 ecosystem. The network uses opera. It is safe and a fast environment to build dApps.
The FTM token marked its all-time high on October 28, 2021, when it was priced at
$3.48. From 17th January 2022, the price started a bearish move and its value has gone down by about 2000%.
- The FTM coin has a circulating supply of 2,803,353,942 tokens, which is 88% of the total supply.
- This crypto asset’s trading volume has fallen by 30% in the last 24 hours.
- Its current market capitalization is $56 million.
Sentiment Analysis of FTM
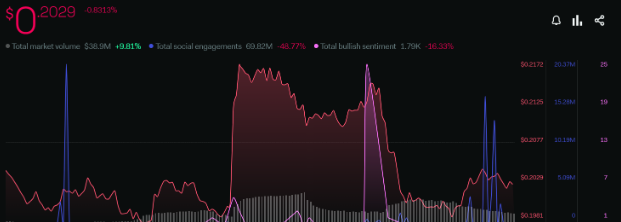
The total market volume of the token has increased by 9.81%. The social engagements have declined by 48.77% and the total bullish sentiment has decreased by 16.33% in the last 1 week. The overall sentiments indicate that the token is under bearish sentiments and the price can go bearish.
Upcoming Events of Fantom
- 13 SEP 2023 – TOKEN 2049 ASIA
Technical Analysis (Weekly)
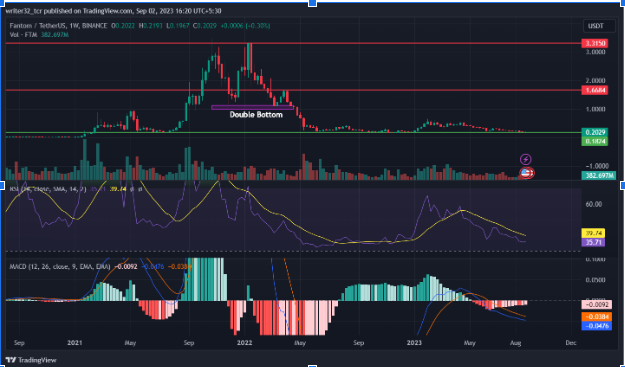
The price of the token made a double bottom in a weekly timeframe. It then followed the bullish move and then declined from the $1.68 range. It started a bearish movement and touched the $0.20 range. The FTM token is currently trading at $0.20, which is a support in the weekly timeframe. The price has been moving from $0.2 to $0.55 for more than a year.
The RSI indicates that the current price is below the neutral level and also under the oversold region. The RSI is at 35.71 points and the SMA 14 is at 39.74, which indicates the price is under a bearish zone.
The MACD is indicating a bearish price move as the EMAs are below the 0 level. The histogram is showing a decrease in the inflow of the volume of the token. The blue fast line is also moving below the red fast line, which shows a bearish side as per MACD.
Conclusion
The overall analysis of the FTM token shows that the token is currently under a bearish movement. If it does not take the support from the $0.18 range, it can fall further. The indicators are also showing negative price action.
Also, If the price takes the support, it can reach to a $0.5 level in weekly scenarios after getting confirmation of the retest of the support.
Technical Levels
SUPPORT: $0.18
RESISTANCE: $1.66 AND $3.3
DAILY RESISTANCE: $0.55
Disclaimer
The views and opinions stated by the author, or any people named in this article, are for informational purposes only and do not establish financial, investment, or other advice. Investing in or trading crypto assets comes with a risk of financial loss.
Leave a Reply