
 PRICE ANALYSIS :- READY FOR A BREAKOUT")
- PRICE IS DOWN BY 93% OFF HIGHS AND IN A STRONG BEARISH GRIP.
- PRICE DOWN BY 47.93 % IN A YEAR AND 6.07 % IN A MONTH INDICATING A STRONG DOWNWARD TREND.
- PRICE SURGED MORE THAN 5% IN A WEEK SHOWING A STRENGTH NEAR SUPPORT.
MARKET CAPITAL OF HUOBI (HT) COIN – $ 398.051 M
CURRENT MARKET PRICE OF HUOBI – $ 2.45
After listing the price surged more than 50 % in just 2 weeks but from that level the price is continuously declining and till now it has dec;lined over 90% which is surely a disastrous run till now.
HUOBI price surged 5% in a week and up by 1% in the current session making a rising streak of 5 green days conveys a strong message that the buyers are very strong in this zone as sellers are nowhere visible on the chart at least.
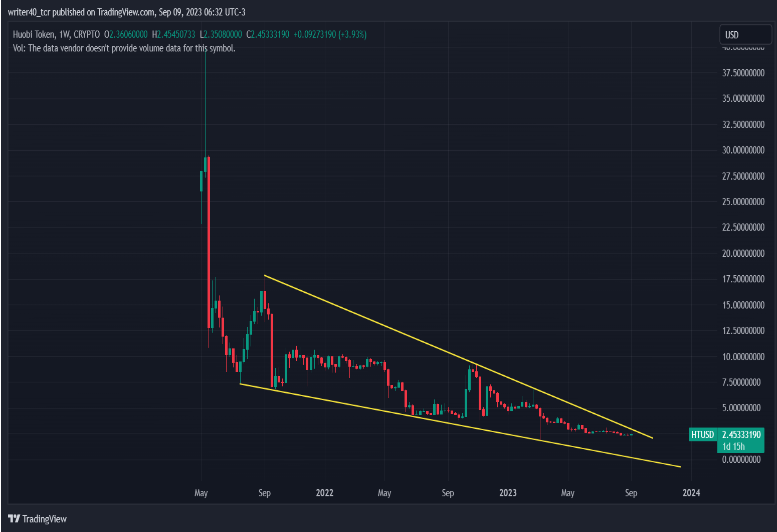
In the weekly time frame the price has formed a falling wedge which is taking the price down on every rise as the market structure on the weekly time frame is totally broken and since listing witnessed a major decline from upper levels.
This kind of structure is not suitable for someone who is looking to get some handsome gain on the investment, till the price is trading under this pattern it will feel pressure on every rise.
CAN PRICE ABLE TO CROSS THE RESISTANCE?
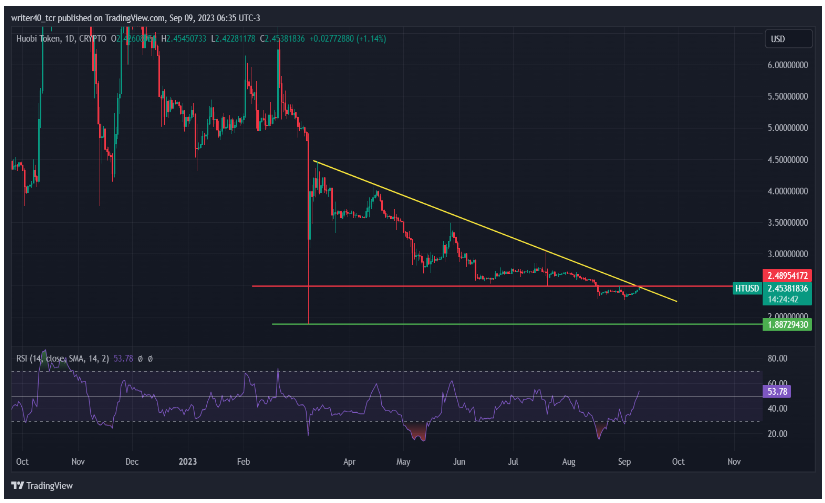
Huobi formed a falling wedge pattern where the trendline of resistance is providing some support to the seller and it is currently present near to the level $2.47 , and the support of the same pattern is $ 1.89.Price shattered the previous support level of $ 2.45 and currently trading below it and facing a rejection , although the price created a new demand zone near $2.28 which is providing some relief for the buyers .
Currently the price is trying to break the resistance levels of $2.453 which is colliding with the trendline resistance and price has shown some bear trapping as it has broken the support but not sustaining below.
The positive sign for the bulls is that the Relative Strength Index (RSI) is gaining momentum and now placed above the halfway mark of 50 which is a positive sign for the bullish trend and it can give the necessary boost to the price to break the resistance level.
CONCLUSION –
As the price is gaining the momentum near the resistance area so it will try to breach the resistance levels as the RSI is showing a positive sign for the buyers and if it breaches the levels then it will move towards $3 and $3.50 levels but if the price face the rejection from the trendline and fall below the $ 2.28 levels then it will unlock its way towards $1.88.
TECHNICAL LEVEL :-
RESISTANCE- $ 2.50
SUPPORT – $ 2.25
DISCLAIMER-
The views and opinions stated by the author, or any people named in this article, are for informational purposes only and do not establish financial, investment, or other advice. Investing in or trading crypto assets comes with a risk of financial loss.
Leave a Reply