

- After giving bumper returns to the investors, Kodal Mineral’s stock is again down to April low levels.
- The stock has generated negative 30% returns in the past 3 months.
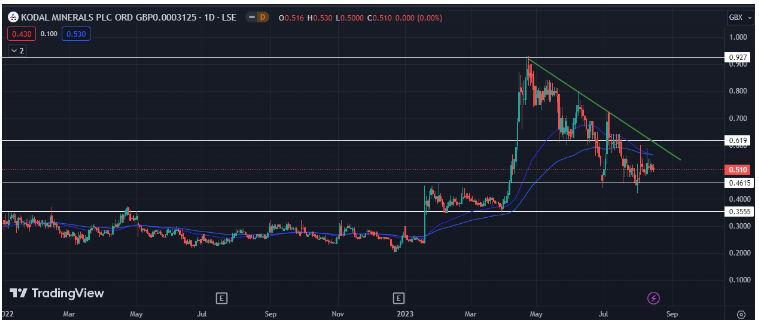
- A bearish trendline is visible on the chart and investors hope a big breakout lies ahead.
Kodal Minerals is a mining development and excavation company from the Central Africa region. The company was founded in 2010 and is currently headquartered in London.
The company’s financials seem to be a little weak right now. Net loss over the years has reduced consistently, but the company is yet not profitable. The past 2 quarters show the poor performance of the company which is a big reason behind the stock’s downward movement.
Technical analysis for the stock
After gaining more than 100%, Kodal stock has since then been constantly moving down creating problems for its investors. The stock touched .92£, Koral stock took a huge u-turn with huge selling volumes.
The stock at times has shown good buying volumes but was always resisted by a trendline which can be seen in the above chart. If the price sustains the current support at .46£, we can see a possible breakout for the trendline.
The stock is currently stitch in a zone between .46£ and .69£ and has tested the support at .46£ twice but managed to stay afloat. The next challenge for the stock lies in staying above this support as the current setup looks weak for it.
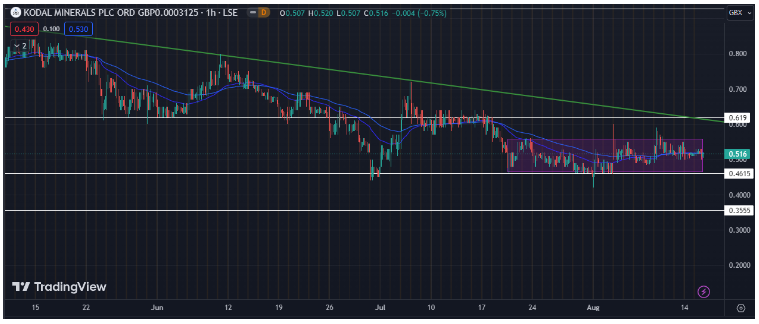
A sideways movement began in the stock since mid July and the price is yet trying to breach that zone but weak volumes stand as a challenge. The more this sideways movement continues, the bigger will be the move ahead.
If the price does see a surge in buying volumes, we can see a breakout for the trendline above. If that does happen, a strong resistance at .62£ will be the first target.
If the stock goes by how most indicators predict, we may see some more downside as the setup and the indicators suggest the price to break down even more. In that case, .46£ will be the first support and the downside target as well. If the price sustains above this support, then we might see some recovery in the prices.
As per analysts, the stock shows a huge upward movement in the next 1 year with the target price at 1.5£. The current setup does not look too good but in the long run, we might see good recovery if the overall sentiment in the market stays positive.
Conclusion:
The stock currently looks weak but we might see big breakouts ahead. The stock is at crucial levels right now and only if it crosses its immediate resistance, one should look to enter. A big move is expected since the stock has been moving sideways for a very long time now.
Important technical levels-
Major support level- .46£ followed by .35£.
Major resistance level- .56£ followed by .61£.
Leave a Reply