

The prices hiked up after news of the launch of the EDX crypto exchange was out.
- MARA stock is reporting inconsistent revenues with net losses; how long can bullish momentum persist?
- The stock is looking to take support from its 50 EMA.
Marathon digital holdings, founded in 2010, is a listed company on NASDAQ. It is engaged in the business of mining cryptocurrencies, along with a major focus on the blockchain network and generation of digital assets as a digital asset technology company. The company is headquartered in Las Vegas, USA, and it is being led by CEO Fred Thiel.
Brief Financials and Key Performance Ratios:
- The revenue of MARA stock as reported in the last quarter, March 2023, was $117 Million.
- The gross profit of MARA came up negative as -$15 Million in the last quarte.r
- The net profit was reported to be -$7 Million, which was balanced by some other non-operating income.
- The trailing twelve months (TTM) gross margin stands at -50.34%.
- The TTM operating margin is -557%.
- The TTM net margin of MARA stock is -581%.
- The earnings per share of TTM is $-5.98 due to a negative net income.
- The company has a high debt-to-equity ratio of 1.34.
- MARA is generating a negative Return on Equity of -122%.
The Metrics have been calculated by financial statements, provided by macrotrends.net
MARA Stock Previous Price Action and Forecasting
MARA stock clocked an all-time high price of $154.7 at the end of December 2014, and since then it has not touched that point again . The 52-week high price of MARA is $19.8, which is 25% above the current price of $15, and the all-time low price is $3.11. Between these ups and downs during the year, the average price stayed at $9.9 during the 52 weeks.
MARA’s current Price Action and Forecast
MARA experienced a significant price surge propelled by two key factors: the notable rise in Bitcoin prices and the introduction of crypto EDX markets, supported by renowned Wall Street firms. These developments collectively played a pivotal role in driving the upward momentum of MARA’s stock.
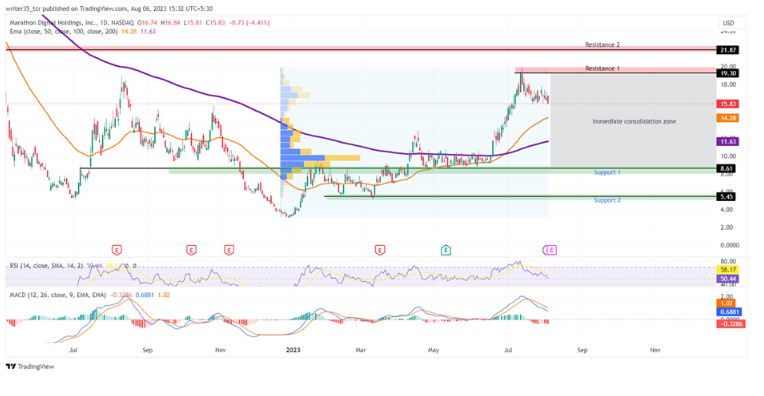
Examining the support and resistance levels, the stock has ascended well beyond the initial support at $8.61, which exhibited robust trading volumes. The second support level resides at $5.45, albeit with comparatively lower volumes, indicating potential levels of price cushioning.
On the resistance side, the first hurdle is at $19.30, representing a point where upward momentum may encounter resistance. Beyond that, the second resistance emerges at $21.8.
Indicators
The MACD indicator revealed a noteworthy development, as the signal line crossed the MACD line around July 20, 2023. This occurrence signifies a potential short-term downtrend, suggesting a shift in market sentiment.
Turning to the relative strength index (RSI), a notable shift is evident. After reaching the elevated level of 79 points, the RSI has retraced to around 50 points. This movement reflects a sideways market sentiment, indicative of a period of consolidation or indecision.
The Exponential Moving Averages (EMAs) further contribute to the analysis. The 50 EMA has crossed above the 200 EMA post the mentioned news. At present, the 50 EMA is gradually approaching the price level at $14.28, followed by the 200 EMA situated at $11.63.
Is MARA stock worth buying right now?
From an investor’s perspective, MARA’s financial performance indicates a loss-making trend and inconsistent revenue generation. This historical pattern is likely to influence the long-term trajectory of the company’s stock price, as observed previously. As a result, we advise caution against considering an investment in this stock.
Looking at the viewpoint of a trader, the MACD’s recent sell signal suggests a bearish sentiment in the short term. The RSI, positioned in the middle, indicates a balanced market sentiment that may make it challenging for bullish momentum to gain significant traction. However, there is a possibility of bullish movement if the price finds support from the 50-day moving average (DMA), potentially influencing a positive shift in the near term.
Conclusion
Founded in 2010, Marathon Digital Holdings is a NASDAQ-listed company. However, its financial performance has been marked by inconsistent revenue figures coupled with net losses. The current stock price seems to be seeking support from the 50-day moving average (DMA). Meanwhile, it’s worth noting that the MACD indicator has recently given a sell signal, which could indicate a bearish sentiment in the short term.
Technical levels:
Support: $8.61, $5.45
Resistance: $19.30, $21.87
RSI: 50.4
50 EMA: $14.28
100 EMA: $11.63
Disclaimer
The views and opinions stated by the author, or any people named in this article, are for informational purposes only. They do not establish financial, investment, or other advice. Investing in or trading crypto assets comes with a risk of financial loss.
Leave a Reply