- DGE(Diageo Plc) is a British multinational alcoholic beverage company.
- DGE was founded on 17th Dec ‘1997. The company was formed from the merger of Guinness Plc and Grand Metropolitan. The stock is listed on the London Stock Exchange (LSE).
- In this article, we will analyze the DGE stock price.
The DGE stock is in an uptrend and it seems good for a long-term investment. It might take another support from the uptrend and continue its upward movement in the future.
However, the stock is retracing towards the trend line and it can take the 3rd support there. Thus, the stock can go up and maintain that uptrend.
Moreover, we will analyze how the stock is performing in the yearly, monthly, weekly, and daily time frames.
Technical analysis of DGE(Yearly)
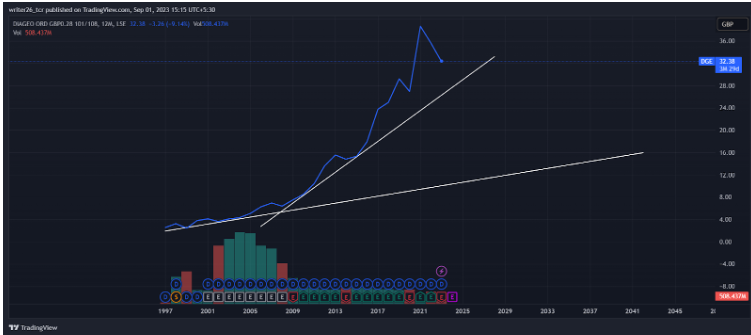
The stock is in an uptrend in the yearly time frame. The stock is very much suitable for a long-term investment. The chances of generating a high rate of returns are possible because the stock is in trend from the beginning. The stock is making new higher highs and higher lows and that indicates an uptrend.
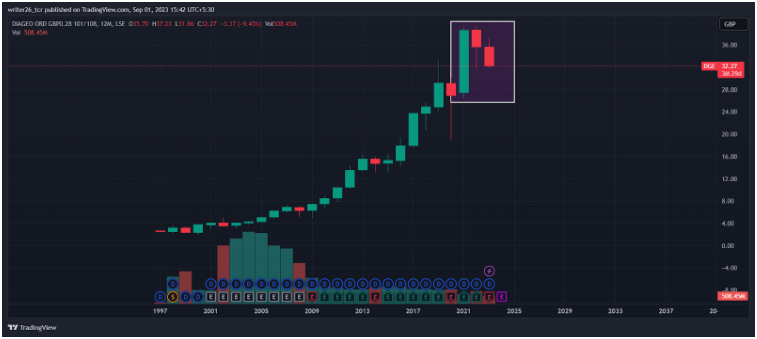
The pattern in the rectangle represents the evening start. It indicates the trend is about to reverse. It occurs in the uptrend and gives a signal that the trend is about to end. So, the stock is about to start its retracement. There is an opportunity to invest when the stock comes to make the support at the trend line.
Technical analysis of DGE(Monthly)
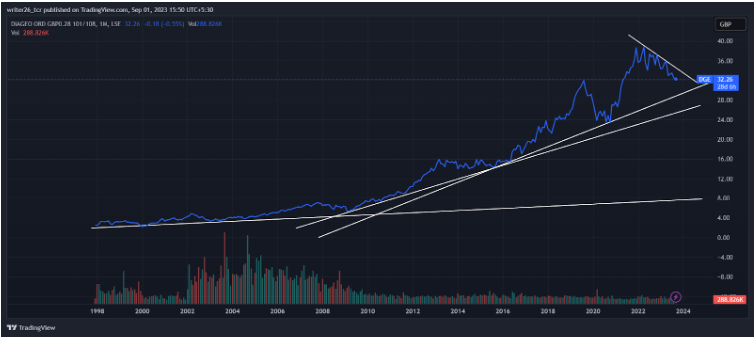
In the monthly time frame, the stock is in an uptrend. Yet, near the current market price, the stock is in a downtrend. The stock is retracing and can take support from the uptrend line. It can move up in the future. The stock is very good for investment purposes because is in an uptrend in monthly and yearly time frames.
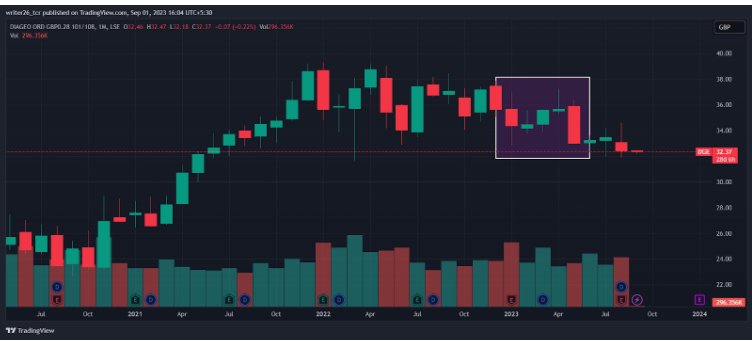
The pattern in the rectangle represents a falling candlestick pattern. It indicates that the bulls tried to break the downtrend but were unsuccessful. The pattern confirms that the stock may continue its downtrend. The result was the same as the stock continued its downtrend.
Technical analysis of DGE(Weekly)
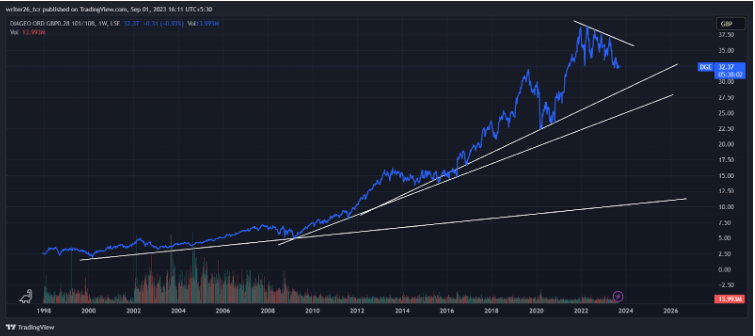
In the weekly time frame, the stock is in an uptrend. In all time frames the stock at its current market price is in a downtrend. It can retrace to the uptrend line and take support from the trend line. The stock can again start its upward movement because there are multiple support points present on the uptrend line. It is offering investors a chance to invest and gain impressive returns.
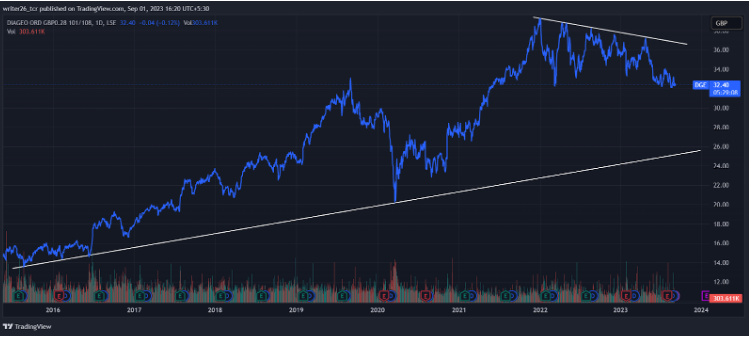
In the daily time frame, the stock overall is in an uptrend. However, the stock is near the current market price in all time frames. It is in a downtrend so the investors should wait till it returns to the support points on the uptrend line. Thus, there will be chances for the stock to show some upward movement. It can impressive returns on the investments made by the investors. The stock is good for short, medium, and long term investments.
Summary
The stock is essentially in an uptrend position in the yearly, monthly, and weekly time frames. It is ideal for long-term investment, but it is in a downtrend in the daily time frame.
Levels
Resistance Level- GBP- 38.77 and GBP- 35.29(Daily Time Frame)
Support Level- GBP- 34.52 and GBP- 32.40(Daily Time Frame)
Disclaimer
The analysis is done to provide information through technical analysis and no investment suggestions are given in the article.


Leave a Reply