

: DOT Coin Price Prediction For The Year 2023")
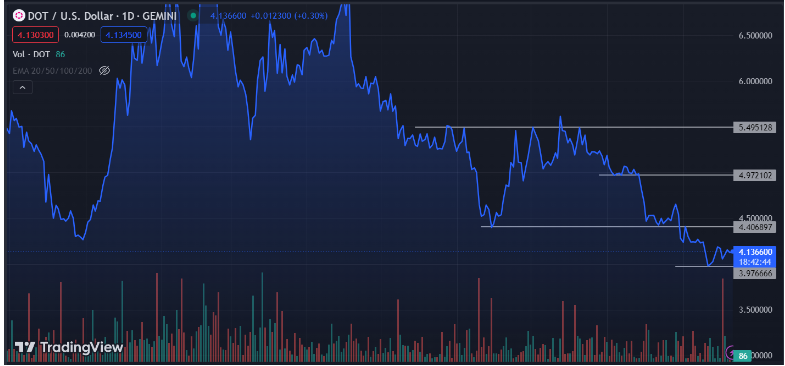
- The DOT coin is currently trading at $4.13 after dropping from its last lower high(LH).
- DOT/USD price is ranging between 2 levels.
- DOT coin price is trading below all the EMAs, indicating a downtrend.
The DOT token price is at $4.13 after dropping from the last swing high on July 13 2023. The price dropped nearly -26.38% during the two and half month duration. On the other hand, the buyers are ready to push the price up to the $5.49 resistance level.
DOT/USD price is trading between the 2 levels from $4.40 to $3.97 with a volume of $91,042,472 (-9.72%). The upper price level could also become the strong support, but the price has already declined from that level, which means that the level won’t become strong if the price once again reaches there.
Since September 13 2022, the DOT token price started a downtrend from $7.96, and subsequently, buyers were able to touch that level only once. As per the EMAs, the price will continue to trade in a downtrend unless it gains some major bullish momentum.
How And When Will the DOT Token Recover
The sellers have achieved two significant targets at $5.99 and $4.20, and now the price is poised to approach previous resistance levels at $5.49 and $7.05. Following this, sellers will attempt to drive the price lower to continue their downward trend. However, if strong support emerges, characterized by a bullish impulsive move, it could become challenging for sellers to push the price down further.
Sellers are expected to become more active as the price approaches resistance levels, anticipating that investors will step in and drive the price higher. On the other hand, buyers tend to adopt a more technical approach. They prefer to wait for bullish impulsive candles as confirmation before entering the market.
Technical Analysis Of DOT/USD
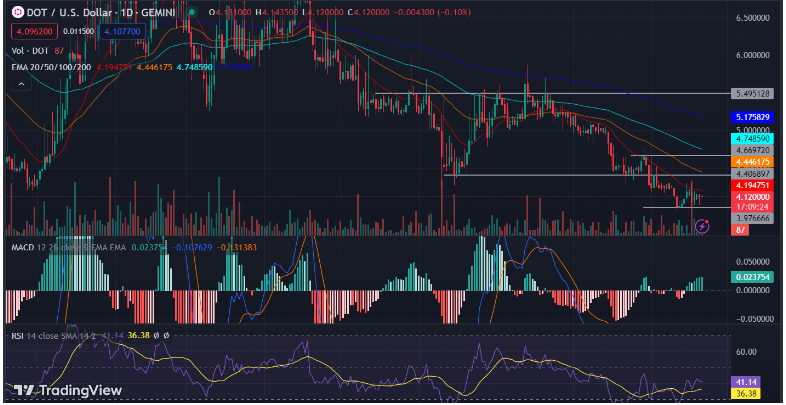
The DOT/USD price is currently at $4.12 below all the EMAs, which means that the price is totally in a downtrend. The 20-day EMA is at $4.19, the 50-day EMA is at $4.44,the 100-day EMA is at $4.74 and the 200-day EMA is at $5.17. The distance between all the EMAs are indicating that the trend will continue downwards for a short span of time and whenever the price rises above the 100-day EMA, there will probably be a major change in the trend.
The MACD indicator is showing signs of more volume on the bullish side rather than the bearish side. The MACD line is averaging at -0.10, which is above the signal line at -0.13. Both of these signals indicate that the volume is becoming more bullish in nature. This suggests that there may be a shift towards more buying activity in the market.
Additionally, the relative strength index (RSI) is indicating bullish divergence in strength. The RSI line is at 41.14, which is above the signal line at 36.38. This implies that, compared to the price chart, the RSI is showing more strength in bullish scenarios and less strength in bearish scenarios. It’s possible that at the current price level, buyers are more active compared to sellers, which aligns with the idea of increasing bullish sentiment.
DOT Coin Price Is Ready For An Uptrend
Technical Levels
- Resistance Levels: $4.66 and $5.49
- Support Levels: $3.97 and $3.54
Disclaimer
The views and opinions stated by the author, or any people named in this article is for informational purposes only. They do not establish financial, investment or any other type of advice. Investing in or trading crypto assets comes with financial loss.
Leave a Reply