


- The price of MINA is trading near $0.415. The 24-hour trading volume was $7.733 million.
- The MINA price is observing a fall of -0.48% in the last 24 hours.
- The MINA year-to-date return is -3.92%.

About MINA
The Mina Protocol is described as the world’s lightest blockchain. The Mina Protocol is lightest because its size is designed to remain constant despite growth in its usage. The Mina Protocol is a minimal succinct blockchain that is built to curtail computational requirements to run DApps more efficiently. Furthermore, we can say it is balanced regarding security and decentralization. This project was earlier known as Coda Protocol but was later rebranded in 2020 to Mina Protocol. The Mina network has a size of only 22 kb which is very small when compared to Bitcoin which has a 300GB blockchain.
The protocol uses zero-knowledge succinct non-interactive arguments of knowledge, a cryptographic proof that enables someone to authenticate information without revealing said information. At the heart of the Mina protocol is MINA, its native currency, which functions as a utility coin and medium of exchange.
Trend Analysis
By considering trend & price information history, we can say that MINA is in a downtrend. The cost has declined -20.12% within the past seven days and we are able to say that MINA is showing poor performance presently.
MINA Trading Downwards
Technical Analysis (1D Timeframe)
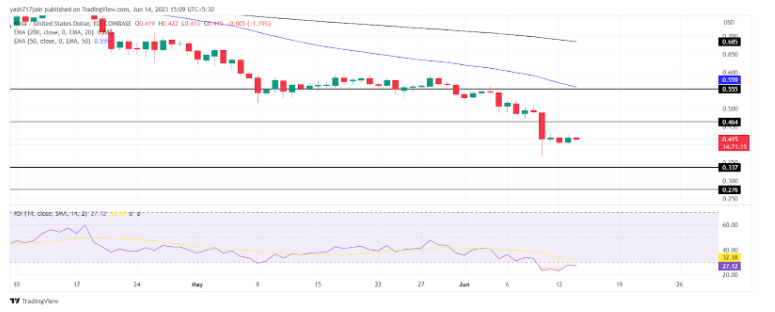
The price of MINA at present is trading below 50 EMA which suggests the price could fall soon. If the sellers continue to push the price downwards, it could fall more in its value within a week. Hence, indicating sell.
The price of MINA at present is trading below 200 EMA which suggests the price could Fall more soon. If the Sellers continue to push the price Downwards further it could Decrease more of its value within a week. Hence, indicating sell.
The Relative Strength Index (RSI) momentum oscillator is a popular indicator that signals whether a cryptocurrency is oversold (below 30) or overbought (above 70). The RSI line has been moving near the oversold zone for the previous few days. The value of 14 SMA is 32.18 points and the RSI line is near 27.12. This indicates that the MINA market position is in the oversold zone; currently, the line suggests more fall in the zone. Hence, indicating sell.
As per the Trendline, it’s respecting the trendline and trying to climb up from the trendline. For now, it’s consolidating but can go downwards more shortly. So, the price of MINA can continue to fall or reduce.
Conclusion
According to the analysis, the indicators are supporting the bears. If the price continues to move under the seller’s control, it is expected to Fall more soon or it can consolidate at the current levels. Presently, the sentiments of investors and traders are bearish regarding the price of MINA in the 1D timeframe.
Technical Levels:
- The Nearest Support Zone – $0.337 then $0.276
- The Nearest Resistance Zone – is $0.464 then $0.555
Disclaimer
The views and opinions stated by the author, or any people named in this article, are for informational purposes only and do not establish financial, investment, or other advice. Investing in or trading crypto assets comes with a risk of financial loss.
Leave a Reply