


- Lido DAO price prediction shows that the LDO token has been trapped in a Range bound market.
- LDO token reported year-to-date gains of 124.84%
Lido DAO’s (LDO) price prediction indicates that the price has been trading in a consolidating market condition since February 2023. The LDO token jumped 250% from its swing low of $0.921 to the resistance of $3.00. It was followed by a 50% decline from the resistance to the support of $1.56. Since then, the price has been trapped between the support and a local resistance of $2.458.
At the time of writing, the current market price of LDO coin is $2.12. The 24-hour trading volume jumped 11.00%. The market is down 7.25% in the last 24 hours. The overall market cap of LDO tokens is $1,869,005,981.
Lido DAO is Trapped in Range Bound Market.
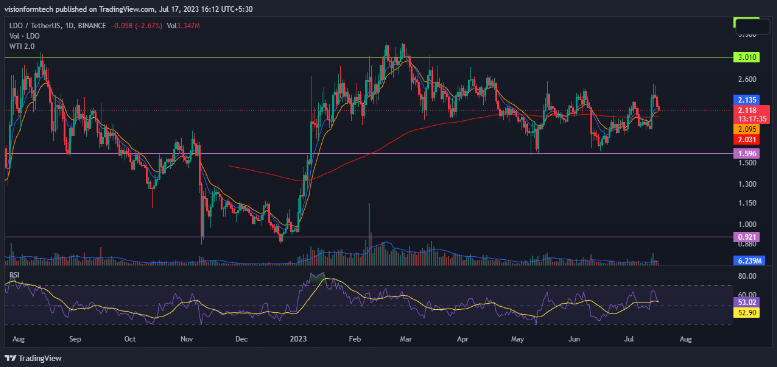
Source: LDO/USDT 1D Chart by TradingView
Lido DAO’s (LDO) price prediction reveals that the LDO token price has remained stagnant due to the range-bound market. Long-term investors are getting frustrated due to the slow growth of the LDO token. The market is moving to and fro from the 200 EMA, which is running flat. This means the direction of the market is sideways.
The present situation is being enjoyed by swing traders and short-term investors as it becomes easier to predict the direction of the market within the range. It’s important to keep in mind that the LDO crypto is relatively new, and the technical analysis can be less accurate due to the lack of past data.
Can the Price Break the Resistance to Move Up?
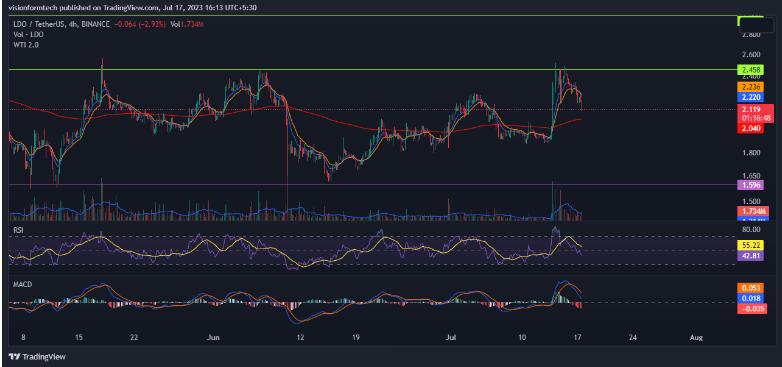
Source: LDO/USDT by TradingView
The 4-hour chart gives a closer look at the current market situation. The LDO token is moving between support and resistance. The market took support on June 15, 2023, and started its move to the upside. The market showed strong momentum after a pullback on July 13, 2023. The LDO token price made a bullish move of 30% to the resistance before reversing.
After testing the resistance, the LDO coin price has corrected 13% so far. The price is trading above the 200 EMA, which can be bullish in the short term. However, a rejection at the resistance means the price could fall to test the support. The market may get volatile only if the price escapes the range. Only time will tell what the direction of this move will be.
RSI: The RSI indicator is currently at 44.68 This is a condition of a bearish to sideways momentum. The market may decline aggressively if the RSI goes below 30.
MACD: MACD is making a bearish crossover above the 0 line. This indicates that the market may witness a correction but the prices won’t fall aggressively until the indicator goes below the 0 line.
200 EMA: On the 4-hour chart, the price is trading above the 200 EMA. This is a bullish sign and an indication that the buyers are in control. The 200 EMA acts as a dynamic support, and the prices may continue to move up until the price breaks below the indicator.
Conclusion:
Lido DAO’s (LDO) price prediction indicates that the price has been trading in a consolidating market condition since February 2023. It is clear that the price is trapped in a range and it would be best for the breakout of the range to establish a direction of the price in the mid-term. Meanwhile, some investors are playing along the swings of the range to turn quick profits. It would be wise to set alerts at the support and resistance and react according to the price action.
Technical Levels
- The nearest support level: $2.458
- The nearest resistance level: $1.596
Disclaimer:
The views and opinions stated by the author, or any people named in this article, are for informational purposes only and do not establish financial, investment, or other advice. Investing in or trading crypto assets comes with a risk of financial loss.
Leave a Reply