


- KKR’s price is currently trading at $60.19.
- KKR price is indicating a bullish sentiment.
KKR & Co Inc. was founded in 1976. The company was founded by Jerome Kohlberg JR. and cousins Henry Kravis and George R. KKR is a financial investment firm.
The company provides comprehensive financial services, including asset management, capital market solutions, and insurance products. In the asset management segment, they offer various investment options such as private equity, liquid strategies, capital market, and principal activities solutions. These services involve managing client investments and providing tailored investment strategies.
Additionally, the company operates in the insurance sector, offering life insurance and reinsurance solutions to clients. This aspect of their business enables them to provide risk management and insurance coverage to individuals and businesses, safeguarding against potential financial uncertainties.
Is KKR Price Heading Towards a Bullish Momentum?
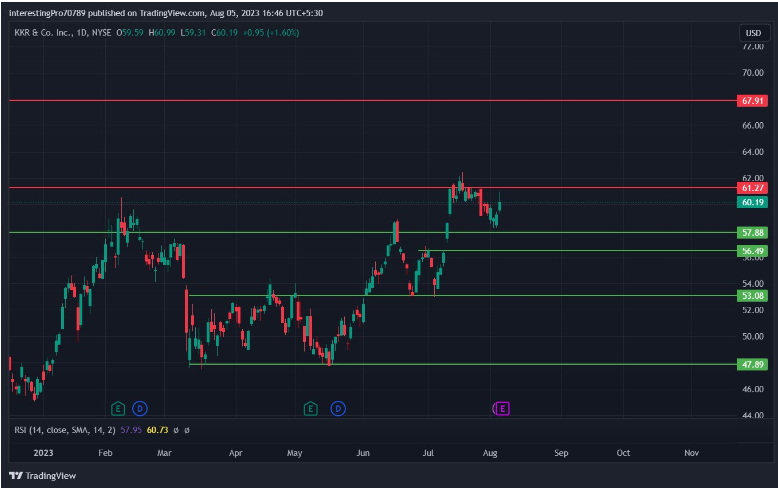
In March 2023, KKR’s price formed a support level at $47.89 and subsequently rallied to the $53.08 resistance level. In April, the price briefly closed above the $53.08 resistance, but it turned out to be a fakeout, leading to a rejection, and the price returned to the $47.89 support level.
After consolidating within this range, KKR’s price broke out above the $47.89 resistance, triggering a bullish rally to the $57.88 resistance level. The price experienced a rejection from $57.88 but found support at $53.08, forming a double bottom pattern.
In July 2023, the price broke out of the double bottom neckline and the $57.88 resistance on the same day, propelling the price to the $61.27 level. Currently, the price is trading between the $61.27 and $57.88 levels.
If the price sustains above the $57.88 level, it indicates continued bullish sentiment, and the price may advance towards the $67.91 resistance level. However, if the price closes below $57.88, it might lead to a decline, potentially targeting the levels at $56.49 and then $53.08.
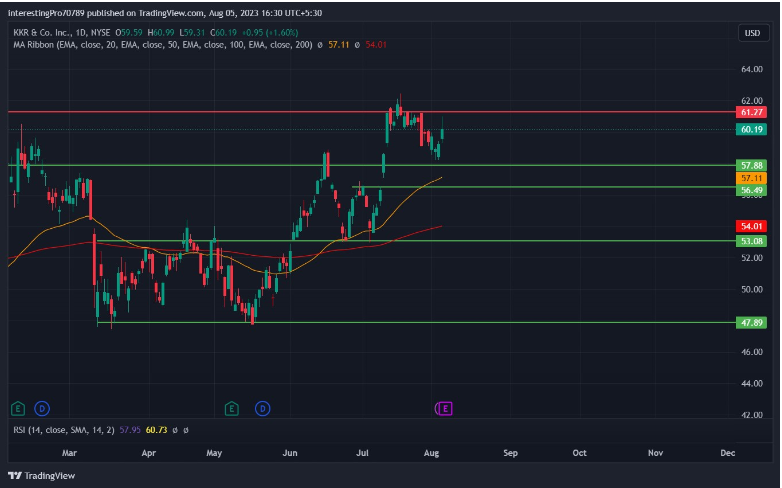
The 50 EMA (yellow line) is currently at $57.11, while the 200 EMA (red line) is at $54.01. Both EMAs are trending upward, indicating a positive trend in the KKR stock price.
The fact that the price is trading above both the 50 EMA and 200 EMA further confirms the bullish sentiment. This suggests that the stock’s price is performing well and is above the average levels calculated based on these moving averages.
Moreover, the recent golden cross, where the 50 EMA crossed above the 200 EMA from the downside to the upside, is considered a strong bullish signal. This occurrence suggests a potential uptrend in the stock price.
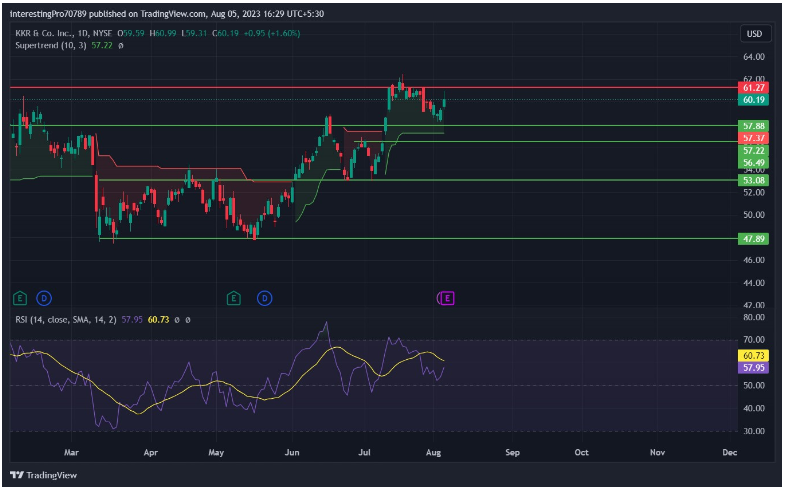
The relative Strength Index is currently 57.95 and is trending in an upward direction after taking support from the 50 RSI level, which indicates that bullish sentiments are still present regarding KKR stock.
The super trend indicates that the KKR price is bullish as the price is still trading above the green line. If the price closes below the green line then a bearish move can be seen.
Conclusion
The overall chart of KKR & Co Inc. is bullish. The breakout of the resistance level $61.27 can help the price to reach $67.91. The indicators mentioned above also indicate bullishness as of now.
Technical levels
Resistance levels:$61.27 and $67.91
Support levels: $57.88 and $53.08
Disclaimer
The views and opinions stated by the author, or any people named in this article, are for informational purposes only. They do not establish financial, investment, or other advice. Investing in or trading crypto assets comes with a risk of financial loss.
Leave a Reply