

 Price Analysis Will FTM Break the Resistance")
- The price of Fantom (FTM) is trading around $0.2966.
- The 24-hour volume is $828.18M which decreased by 36.66% in 24 hr.
- FTM price has been observed to decrease by 1.77%.
Introduction
The decentralized blockchain platform Fantom (FTM) was created to offer decentralized apps (dApps) and smart contracts quick, scalable, and secure solutions. It intends to overcome the drawbacks of current blockchain platforms, namely their scalability problems and high transaction costs.
The Lachesis Protocol, used by Fantom, is a novel consensus method that incorporates aspects of the Byzantine Fault Tolerance (BFT) and Directed Acyclic Graph (DAG) consensus algorithms. As a result, the Fantom network can achieve rapid transaction confirmation and high throughput.
Fantom’s capacity to handle a variety of virtual machines (VMs), including compatibility with the Ethereum Virtual Machine (EVM), is one of its primary characteristics. As a result, programmers can utilize Solidity, the programming language used on the Ethereum platform, to create and deploy smart contracts.
Trend Analysis
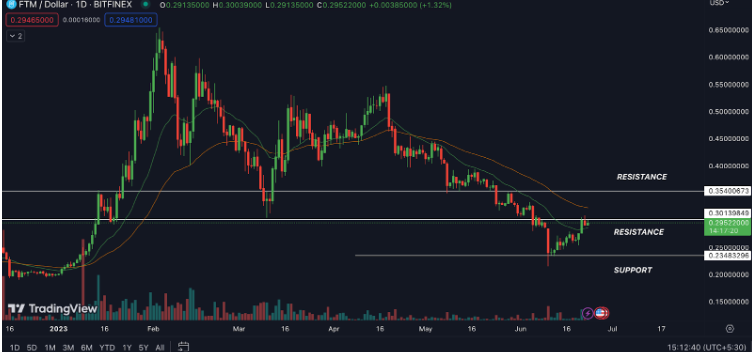
By looking at the trend and price information in the chart we can depict that FANTOM (FTM) is near to its important resistance level. It has taken a reversal from the support level with very good volume and formed an engulfing pattern.
FANTOM (FTM) is Showing bullish momentum
Technical Analysis (1D Timeframe)
Source: Bitcoin SV/USD.1D.CRYPTO by TradingView
FANTOM (FTM) Price Analysis
EMA: The Fantom (FTM) price is currently trading above the 20 EMA and it is below the 50 EMA, which indicates that the price will go up for a short period and again start falling after touching the up of the channel line.
RSI: The RSI for FTM in the daily timeframe is now essential to figuring out the general mood. A reading of the RSI above 50 denotes bullish momentum, while one below 50 denotes bearish momentum The RSI is near the 50 level which is neutral. It’s signifying in a short time price can touch the upper level.
MACD: When the signal line cuts the MACD from below, the indicator is considered to be bullish. In the same way, when the signal line gets cut by the MACD line from the above region, the indicator is considered to be bearish. As we examine the price movement of FTM recently, we can observe that the MACD has been showing a bullish crossover, with the MACD line crossing above the signal line. This shows that the market may be moving in FTM’s favor.
Trendline Analysis:
As per the Trendline, the price is respecting the trendline and the price is reversing from the support level indicating further move. So, as of now the price of the FTM moving in the channel can go up to $0.35 in a short time.
Conclusion
According to the analysis, the indicators are supporting the movement in the bullish direction. If the price breaks the above level with good volume we can expect further up move. Currently, the overall trend of the FANTOM (FTM) is in a frame is in uptrend. Only to be traded if they broke the resistance.
Technical Levels:
- The Nearest Support Level is $0.2348.
- The Nearest Resistance level is $0.3013 and $0.3540.
Disclaimer
The views and opinions of the author, or anyone named in this article, are for informational purposes only. They do not offer financial, investment, or other advice. Investing or trading crypto assets involves the risk of financial loss.
Leave a Reply