

- EQT stock price has shown a recent uptrend after being pushed down hard by the bears
- The stock has risen up after taking support from its 50 EMA; what’s next?
- MACD looking to make a cross-over, but to which side?
Despite the good financials in recent years, Enquest stock price broke its major resistance during February when the bears forced for a gap-down opening,
The price fell from £ 29.86 to 18.36 in February, and soon afterwards, a bearish rally was confirmed as the price again broke its major support of £ 16.78 and came down to the levels of £ 13.9
After testing the bears at this level, it looks like the bullish investors are fighting back, as Enquest stock has seen a trend reversal and is making a comeback.
Technical Analysis of Enquest Stock.
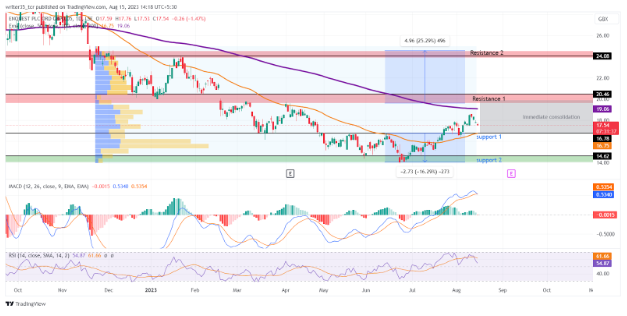
At present, Enquest’s stock price has undergone testing of two support levels and appears to be on the brink of a potential rebound, as it approaches its resistance levels. The ENQ stock price is currently situated within a range defined by various supports and resistances, with the accompanying indicators offering valuable insights into the upcoming market movement.
Support: The immediate support level for Enquest’s stock is observed at £ 16.8, a level that has been tested multiple times in the past and previously served as a resistance level. Additionally, the second support level is established at £ 14.62, which has proven to be a reliable testing level throughout the year 2020.
Resistance: A notable resistance level for the stock is positioned at £ 20, which experienced a significant support break in February 2023. Furthermore, the second resistance level is set at £ 24.1, representing a potential increase of 25% from the current level.
MACD: The MACD chart has maintained a bullish trend since the MACD line crossed over the Signal line in July 2023. Currently, both the Signal line and MACD line stand at the same level of 53, indicating a possibility of a bearish crossover in the future.
RSI: After reaching the level of 70 in late July 2023, the RSI line has exhibited a slight downtrend. Presently, the RSI line resides within neutral territory at 55, while also remaining below its Simple Moving Average (SMA) positioned at 61. This suggests a potential for further weakening prices in the upcoming period.
EMAs: The recent price movement has found support at the 50 EMA level of £ 16.75, resulting in a short-term bullish trend. The 200 EMA is positioned just above the price, potentially leading to a rejection by the bulls as it approaches the level of £ 19.06.
Conclusion
The Enquest stock price forecast appears to be closely mirroring the market’s movements, particularly in relation to its Exponential Moving Averages (EMAs). Recent price action suggests that the stock has discovered a foundation of support at its 50 EMA and subsequently embarked on an upward trajectory.
Looking ahead, if the current bullish momentum continues, there is a potential scenario where the stock’s price could exceed its 200 EMA, positioned at £ 19.06. This outcome could signify a continuation of the positive trend. Conversely, should bearish forces regain dominance, the stock’s price might encounter resistance at the 200 EMA level, leading to a potential retreat. In such a scenario, a pullback towards the immediate support level at £ 16.7 could come into play.
Technical levels.
Support: £ 16.7, £ 14.62
Resistance: £ 20.4, £ 24.08
RSI: 54
50 EMA: £ 16.75
200 EMA: £ 19.06
Disclaimer
The views and opinions stated by the author, or any people named in this article, are for informational purposes only. They do not establish financial, investment, or other advice. Investing in or trading crypto assets comes with a risk of financial loss.
Leave a Reply