- Pivot Point is an indicator of the stock sentiment
- It can be used with other indicators to predict the intraday stock price
What is Pivot Point?
A pivot point is an indicator used in technical analysis. They are used by traders to predict the support levels of a stock and iscalculated based on theof high, low and closing price of a stock. With the use of pivot points, traders can analyse the stop-loss and profit-taking points of any trade. Simply put, the pivot point is an average of the high, low, and closing points of a stock,taken from the previous day’s prices.
The pivot point is also used to determinethe sentiment of the stock. Calculating the market sentiment with the help of a pivot point is relativelyeasy. Traders just need to compare the pivot point of the stock to the current price of the stock, and they can easily calculate the sentiment of the stock forthat day. If the price of the stock on that day is higher than the pivot point, it means that the market is bullish. However,if the stocks current market price is lower than the pivot point, it indicates a bearish sentiment for the stock.
This method is used to calculate pivot points in the stocks that are open for a day or for some specific time frame. Calculating pivot points for the cryptocurrency and forex markets is slightly different because these are open 24/7, with no specific closing or opening time. Traders use GMT time to calculate pivot points in the cryptocurrency and forex markets.
It is best to use a pivot point with other technical indicators because relying solely on the pivot point is not advisable. Stocks will not follow the pivot point every day. While the pivot point is an excellent indicator of the sentiment of the stock, combining it with other indicators like the moving average and Fibonacci extension can providetraders and investors with more accurate stock predictions.
Limitations of Pivot Point
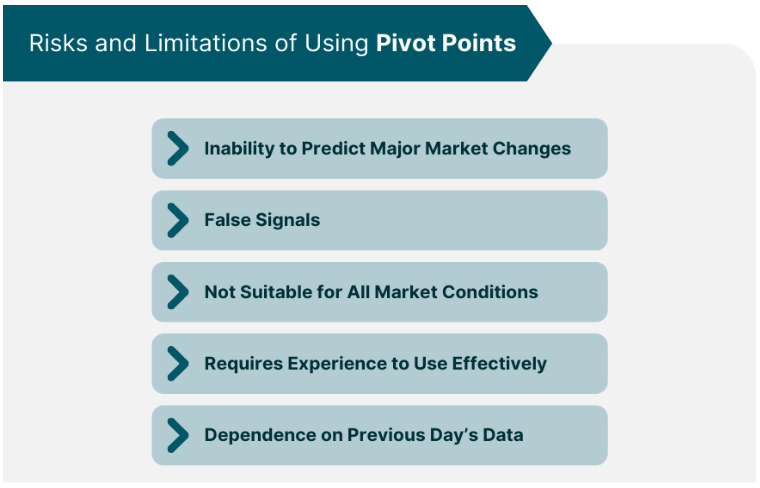
The pivot point is suitable for some traders, while others do not find it useful. This is because the pivot point does not provideaccurate predictions as it does not use a complex mathematical calculation. It is simply an average of the high, low, and closing price of the commodity.
Pivot points cannot be used solely for intraday trades. It is always best to use pivot points with other technical indicators for the best results.

Formula used to calculate Pivot Point
The formula to Calculate Pivot Point = (Previous High + Previous Low + Previous Close) / 3
Strategy to use Pivot Point in Intraday Trading
Pivot Point Bounce
The price of an asset is expected to either move towards a pivot point or bounce off the pivot point. In both situations, traders use two different strategies.
- An asset is bought when the asset price touches the pivot point and reverses from there. In this condition, traders invest in the asset because it indicates that the asset price will go higher in the future.
- If it tests the point from below and bounces off downward, that’s when a trader sells the asset. This is a clear indicator that the asset price is expected to go down in the future.


Leave a Reply