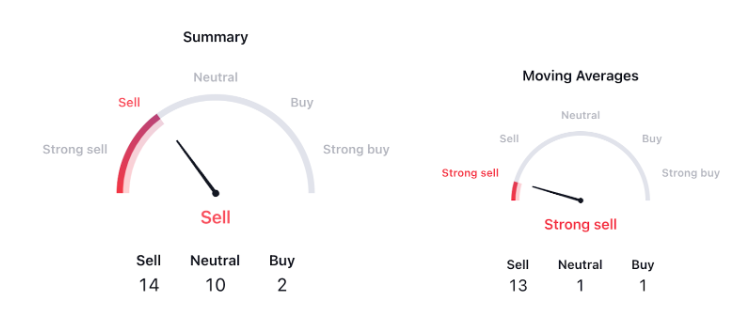
- The Qtum coin shows a sell signal by the technical summary widget.
- The Qtum coin (QTUM) price volume has declined by nearly 5% today.
- This coin’s current price is trading 98% below the all-time high.
The price of QTUM has been consistently declining, forming a pattern characterized by lower lows and lower highs. This price movement has led to the development of a descending triangle pattern, with the current price remaining within this pattern. The pattern is indicative of a bearish trend, signifying a downward trajectory in the market.
QTUM is currently trading at $2.12, experiencing a 0.9% decrease in today’s market session. The coin’s 24-hour trading volume stands at 18 million, showing a 5% decline during today’s session. The circulating supply of QTUM is 104 million.

The technical indicators provide a weak signal for the QTUM coin, with 14 out of 26 indicators suggesting a sell signal. Additionally, the moving average summary strongly advises a sell position for the coin, emphasizing the ongoing downtrend.
QTUM had reached a peak of $106.88 but has since witnessed a continuous decline, amounting to a significant drop of over 97% by the end of January 2023. The current price hovers near a support level, indicating a period of consolidation around this range. This consolidation has formed a descending triangle pattern, typically considered a bearish sign, implying a potential breach of the support level and a further price decline.
The past six months have seen QTUM deliver a negative return of -27%. Overall, the coin’s performance in recent times has not been favorable, and the price structure suggests the likelihood of further downward momentum.
Qtum coin (QTUM) Technical Analysis
QTUM by writer50_tcr on TradingView.com
The RSI value for QTUM has persistently stayed below 50, underscoring a strong downward trend. This bearish trend remains unbroken, with no indications of a bullish reversal or the emergence of buyers in the market.
Furthermore, the MACD line for QTUM remains positioned below the signal line, accompanied by a red histogram on the chart. This configuration presents a weak signal for the coin, hinting at the potential for a price decline.
Conclusion
In conclusion, the QTUM coin (Qtum) exhibits a bearish trend in its chart analysis. It currently trades below the EMA levels, and the RSI remains in negative territory. The coin’s overall structure appears fragile, and there’s a growing bearish sentiment. Considering these factors, it’s probable that the price will experience a decline soon.
Technical Level
- Support Level: $1.74
- Resistance Level: $3.8
Disclaimer
The views and opinions of the author or anyone in this article are for informational purposes only. They do not offer financial, investment, or other advice. Investing or trading crypto assets involves the risk of financial loss.


Leave a Reply