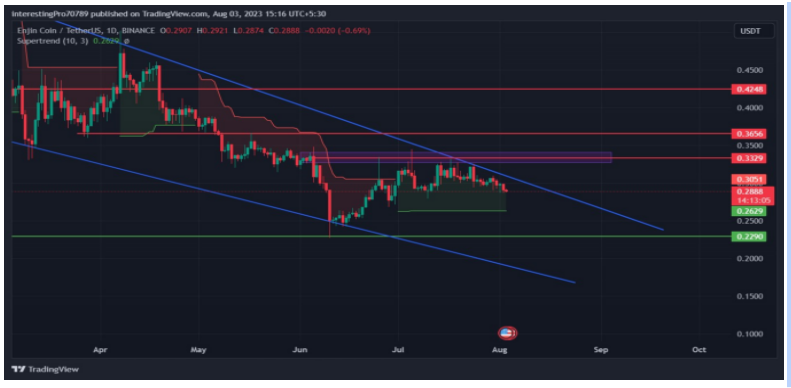
- ENJ’s price is currently trading at $0.2893.
- ENJ is forming a falling wedge pattern.

ENJ coin is currently exhibiting a falling wedge pattern, which is a bullish pattern signaling a potential breakout to the upside. This pattern is characterized by lower lows and higher lows, indicating that buyers are still in control despite facing resistance at $0.3329.
The fact that the support line of the falling wedge has held firm and the price has been making higher lows suggests that the bullish momentum is still intact. However, for a successful breakout to the upside, several factors need to align, such as positive news related to ENJ coin, increased institutional investment, and positive movements in the broader cryptocurrency market, particularly in BTC.
If the ENJ price manages to break out to the upside, the initial targets to watch for would be at $0.3656 and $0.4248. These levels could serve as resistance-turned-support points during the upward movement.
On the other hand, if the price fails to break out of the falling wedge pattern and continues to face rejection at $0.3329, it is more likely that the downtrend will persist, and the price may head towards the support level of $0.2290.

The relative strength index (RSI) is currently at 42.37 and trending downward. The RSI being below the 50 level suggests that the bearish sentiment is prevailing in the ENJ coin’s price.

The SuperTrend indicator currently shows a sideways trend, indicating a lack of a clear direction for the ENJ coin price. Despite this, the price is still trading above the green SuperTrend line, which suggests that there is still buying interest in the market.

Bollinger Bands showthat ENJ coin is oversold. If the price closes below the green line, it may rise to test the resistance at $0.3329.
Conclusion
The ENJ price chart indeed appears to be forming a falling wedge pattern, which is considered a bullish pattern in technical analysis. This pattern suggests that despite the current downward trend, there is potential for a breakout to the upside.
If the falling wedge pattern does break out to the upside, the targets to watch for are at $0.3329 and $0.3656. These levels could serve as resistance-turned-support points during the upward movement.
However, it’s essential to be cautious as some indicators are pointing towards a bearish sentiment, which could continue until the support level at $0.2290.
Technical levels
Resistance levels:$0.3329, $0.3656
Support levels: $0.2290
Disclaimer
The views and opinions stated by the author, or any people named in this article, are for informational purposes only. They do not establish financial, investment, or other advice. Investing in or trading crypto assets comes with a risk of financial loss.


Leave a Reply