- MNDI stock is up by 2.10% in a week and 4.99% in a month but down by (-8.27%) in a year.
- MNDI plc stock has recovered over 15% from its 51-week low.
- MNDI stock’s revenue has risen slightly over the years but significant growth in net income.
Market capital of MNDI PLC – 6.396 Billion GBP The current market price of MNDI PLC – 1337.0 GBP The MNDI stock price was up by 18 GBP(1.36%) in its previous trading session i.e. 15 September. The stock is up by 2.10% in a week and 4.99% in a month which means the short-term trend of the stock is still positive. The stock has declined by (8.27)% in a year which indicates that the price is overall in a downward trend over the longer time frame. The revenue of the company has risen slightly over the years. The revenue has risen from 5.46 billion GBP in 2016 to 7.60 billion GBP in 2022, a rise of over 39% in 6 years. The net income of the company has risen on a good note as the net income has risen from 523 million GBP in 2016 to 1.24 billion GBP in 2022, a rise of over 136% in 6 years. The net debt of the company has slowly declined over the years, as the net debt which was around 1.98 in 2018 is now standing at 888.12 million GBP. One more good thing about the company is that the company has improved its tally of cash and receivables from about 1 billion GBP to 2.2 billion GBP.
Technical analysis of the MNDI stock:
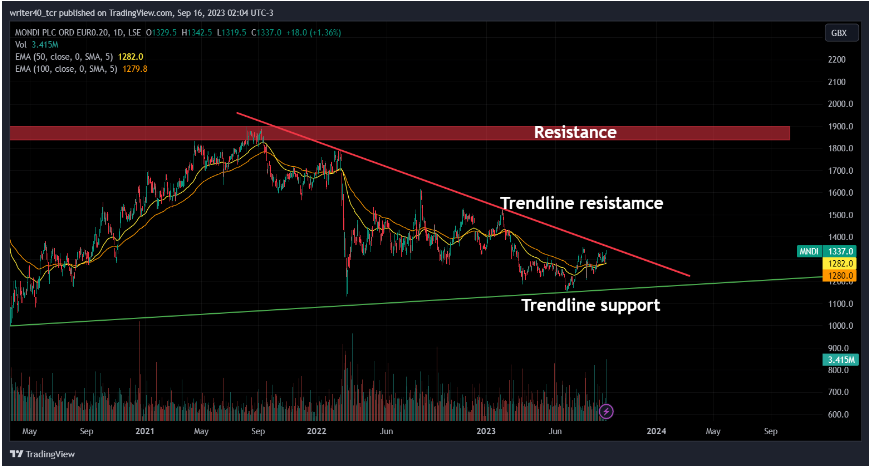
MONDI PLC stock has recovered over 15% from its 52-week low levels and is currently forming a base to go towards more upside levels. Currently, the stock is trading near a long-term trendline resistance which is present near 1370 GBP. Also, the trendline support is present near the level of 1178 GBP.  The price is currently trading above the important EMAs i.e. 50 and 100 which is a sign of bullishness. The price is looking strong near the resistance level as it is trying to break the levels again and again without testing support. The all major resistance level for the stock is present between 1830 -1900 GBP.

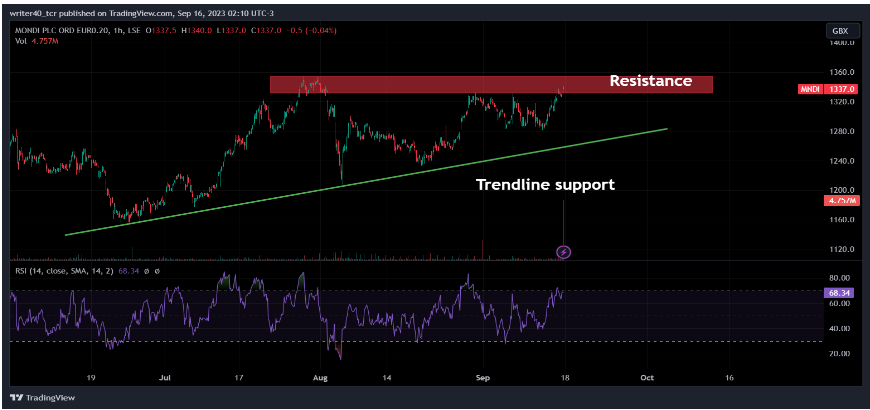
On the hourly time frame the stock is forming an ascending triangle pattern and currently trading at the resistance level. The resistance level of this pattern is present between 1330-1355 GBP. The price has been supported by the trendline support which is present near 1260-1270 GBP. The RSI is also near 68.34% which shows the momentum of the stock is super bullish.
Conclusion:
As the different parameters suggest the same thing we should plan the same thing. The price is forming a bullish pattern on both the time frame and the stock price has also recovered from its 52-week low. The financials of the company are improving and it is expected to perform well in the near future also. If the price crosses and sustains the resistance level as mentioned in the hourly chart then it can show some good upside from that level. The price then can try to attempt the upper level of 1500 GBP and 1900 GBP.
Technical level:
- Resistance – 1330 – 1355 GBP
- Support – 1260 – 1270 GBP
Disclaimer
The analysis is done for providing information through technical analysis and no investment suggestions are given in the article to be made by investors. The coins are unpredictable so investors should have proper knowledge. Cryptocurrencies are highly volatile and risky. Investment should be made with proper technical analysis.


Leave a Reply